Animated diagrams with reveal.js
People that have seen me present might have noticed that I’m a declared fan of reveal.js. Ever since Răzvan Căliman introduced me to it, more than four and a half years ago, I used it for pretty much every presentation that I gave, be it internal or external, text-heavy or pictures-only.
What is reveal.js?
Reveal.js is a web presentation framework. Basically, it’s a JavaScript library that allows people to create and deliver presentations using web technologies (HTML, CSS, JavaScript). This means any Reveal.js presentation is a web page and can be published and accessed as such.
What makes Reveal.js particularly attractive, for me at least, is that it comes with a very useful and pleasant set of visual defaults as well as some nifty features that allow it to compete, for my use-cases, with Microsoft PowerPoint and the like:
- support for split monitors and speaker notes – complete with timers (wall time, elapsed time) and pacing indicator (slow down / hurry up)
- support for piece-by-piece content revealing i.e. not showing all the slide’s contents at once – these are called fragments in Reveal.js parlance
- support for keyboard shortcuts – this makes it work nicely and out-of-the-box with presenters (such as Logitech’s R400)
I strongly suggest you go and take a look at the demo to get a feeling of how a Reveal.js presentation can look and act. If you feel so inclined you can also head to the project homepage to see what can be done with a little bit of extra tinkering.
A word of caution: while little to no experience with CSS is required in order to create a presentation, tweaking the theme-provided styling might require non-trivial CSS changes and overriding some core Reveal.js styling. In this case, you browser’s developer tools is your best friend.
Including graphs and diagrams
There are however some aspects in which Reveal.js falls short compared to dedicated desktop products. One of them is creating visual content to add to your slides. While importing content in any format your browser supports is fairly straightforward, all such content must be created beforehand in an external application. This is in stark contrast with applications like PowerPoint that have built-in tools for creating diagrams, charts, graphs and other visual content. Not only can these be created in-app, but they can also be revealed and animated like any other part of the presentation.
Nevertheless, there are ways to add some degree of dynamism to visual content in Reveal.js and I’m going to explain one such way. It uses SVG, some features built in Reveal.js and just a bit of JavaScript, depending on how fancy you want to get.
HTML, meet SVG
An image format that lends itself very well for outside manipulation via JavaScript and CSS is SVG. SVG can be included and used in HTML documents in a number of ways (on which you can find a thorough summary here), including but not limited to:
- direct markup embeddeding, where an SVG document is a literal part of an HTML document
- inclusion as an
<img>tag, where it can be used just like any other image - usage as a CSS background image
The nice part about the first option is that the SVG markup becomes an integral part of the HTML document’s DOM. That means that scripts running in the document can access and manipulate SVG elements just like any other DOM elements. In addition to that, SVG also supports some (if not most) CSS properties so the same code can be used to transform and manipulate both HTML and SVG content – and this is what we’re going to take advantage of with this technique. Let’s see how all of this can be put together to pull off a simple mission.
The mission
This mission is rather simple: create a Reveal.js presentation that explains the process of making toast, using an interactive illustration where each step’s appearance is controlled individually. Each step should be represented as a circle, each with a different background. For the moment we will not concern ourselves with arrows or other fancy stuff. If you want to see the results in action, check out the live demo here and view its source on gitHub.
To begin with, let’s see how this would look if we went for a text-based approach:
<!-- HTML preamble and Reveal.js boilerplate code omitted. -->
<div class="slides">
    <section>
        <h2>Mission (Im)possible: Making round toast</h2>
        <p class="fragment">Put bread into toaster</p>
        <p class="fragment">Push down on bread</p>
        <p class="fragment">Wait until toaster pushes bread up</p>
    </section>
</div>
<!-- HTML ending tags ommitted -->
If you go and try this yourself, you’ll notice that when the slide is
first loaded, only the title is visible. As we navigate (using N (next) and
P (previous)) you can see parts of the slide becoming visible.
The astute reader might realize however “Why, but I can solve this with just a couple of lines of boring, old, CSS3”. And they would be right. While I encourage you to experiment with pure HTML & CSS as well, let us continue to draft our SVG.
SVG 101
Let’s create our first SVG file, right inside our presentation. As mentioned earlier, SVG documents can be embedded directly inside HTML elements. To keep the example simple, let’s draw only 3 circles (for now), without any text in them.
<!-- HTML preamble and Reveal.js boilerplate code omitted. -->
<div class="slides">
    <section>
        <h2>Mission (Im)possible: Making round toast</h2>
        <svg xmlns="http://www.w3.org/2000/svg" width="300" height="300" viewBox="0 0 300 300">
              <circle cx="75" cy="50" r="50" stroke="black" fill="red" stroke-width="5"/>
              <circle cx="225" cy="50" r="50" stroke="black" fill="green" stroke-width="5"/>
              <circle cx="150" cy="150" r="50" stroke="black" fill="blue" stroke-width="5"/>
        </svg>
    </section>
</div>
<!-- HTML ending tags ommitted -->
Now let’s make a tiny adjustment, by adding the "fragment" class that
was previously used to grant our paragraphs of text on-demand visibility:
<!-- HTML preamble and Reveal.js boilerplate code omitted. -->
<div class="slides">
    <section>
        <h2>Mission (Im)possible: Making round toast</h2>
        <svg xmlns="http://www.w3.org/2000/svg" width="300" height="300" viewBox="0 0 300 300">
              <circle class="fragment" cx="75" cy="50" r="50" stroke="black" fill="red" stroke-width="5"/>
              <circle class="fragment" cx="225" cy="50" r="50" stroke="black" fill="green" stroke-width="5"/>
              <circle class="fragment" cx="150" cy="150" r="50" stroke="black" fill="blue" stroke-width="5"/>
        </svg>
    </section>
</div>
<!-- HTML ending tags ommitted -->
As promised, the elements in our SVG are now shown only upon navigation.
Crafting SVG
Writing SVG by hand can be fun and, let’s admit it, even empowering, but managing anything more complex than a couple of basic shapes quickly becomes difficult, and the constant switching between code editor and browser to preview the results won’t do any good to our productivity, either. So we will use a dedicated editor to craft our final toasting diagram. I chose Inkscape since I’m already familiar with it and it’s open-source, but feel free to use Sketch, Adobe Illustrator or any editor that has the option to export SVG.
Here’s how my final diagram looks like, in Inkscape:
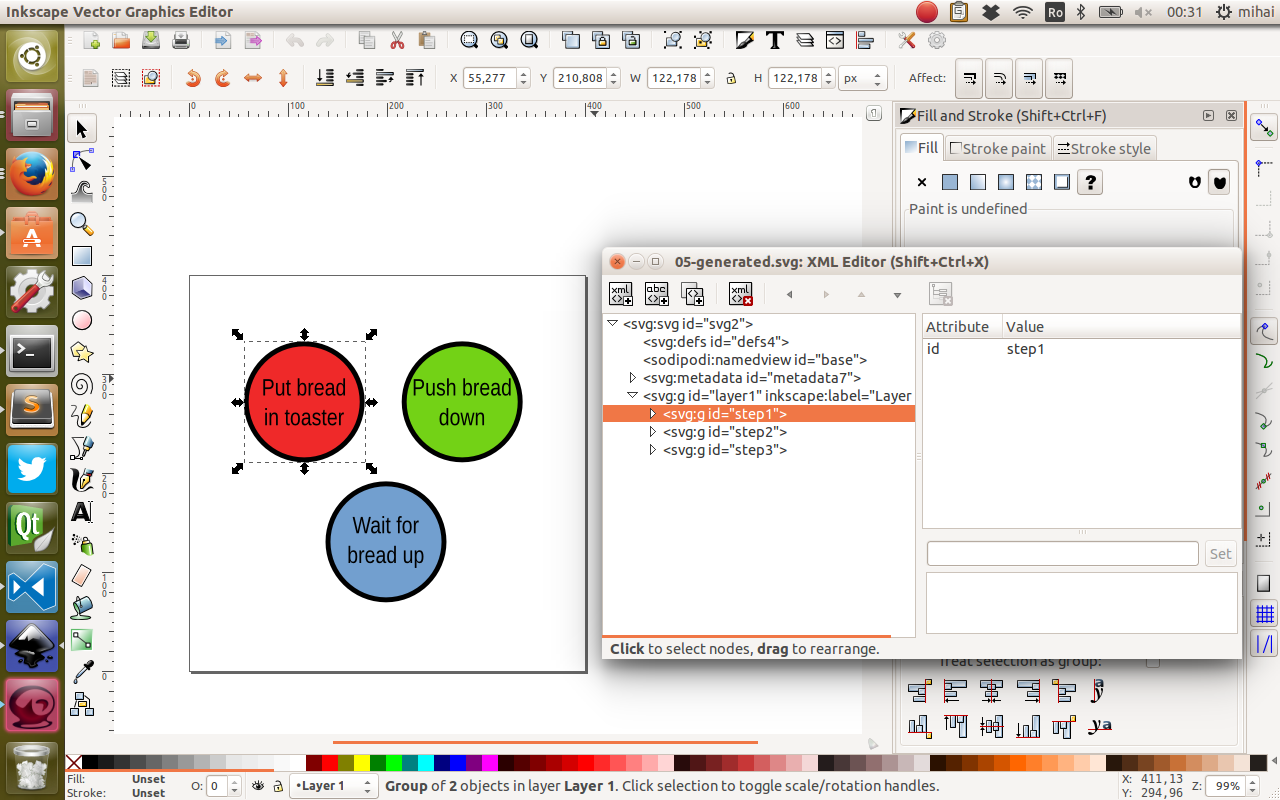
Each bullet is a group, and I’m using Inkscape’s XML editor to give
meaningful id-s to each bullet. I can now export the file as a plain SVG
to get rid of the Inkscape specific markup and extensions and replace the
hand-crafted SVG with the generated SVG. Lastly, we add class="fragment" for
each group to make them appear on-demand.
Externalizing the SVG
A consequence of SVG being a markup vector language is that it’s rather verbose and any image with reasonable complexity will grow well past anything you would be comfortable managing inside another document. This becomes even more of a problem if you want to preserve the look of text elements inside your SVG file and embed fonts or convert text to paths to do that, which add even more bulk. Add more than a couple of such files in a Reveal.js presentation (or any HTML document, for that matter) and it will quickly turn into an un-navigable soup of markup.
In addition to this bloat problem, every time you make a change to your SVG file you have to copy & paste it manually back into the proper place in the document. Not only is this a manual and unglamorous process, but it’s also error-prone, especially given the added complexity of the markup incurred by inlining the SVG files (i.e. it’s easier to insert the SVG the first time than it is to replace it correctly later).
A natural solution for this would be to store the SVG images as independent
files on the disk and reference them in your presentation – just as you
would with a plain PNG or JPEG file. Alas, things are not that simple (but not
hopeless, either). The catch here is that including the SVG file as an <img>
tag will no longer expose it’s elements as part of the DOM. A possible
workaround is authoring your document using external references (e.g.
<img> tag) and then inlining these external references, either on the server
side or on the client side. Since the server-side options vary wildly and are
subject to a lot of restrictions, going forward I will cover the client-side
solution.
Meet SVGInjector
The overall idea of a client-side solution is simple: scan the document for
elements to replace – say <img> tags with an SVG src – and
replace them with the actual contents of the files, usually via an XHR and some
DOM manipulation. While writing such a client-side solution would definitely be
an interesting learning experience in and of itself, the awesome guys at
Iconic created the SVGInjector library just for that.
The code snippet in their quick start guide reflects this idea really well:
<!-- We first include the SVGInjector library -->
<script src="svg-injector.min.js"></script>
<!-- Then in our page we reference some SVG files, just as external images -->
<!-- This way they will render properly even before SVGInjector is done with its job -->
<img class="inject-me" src="image-one.svg">
<img class="inject-me" src="image-two.svg">
<!-- Once the document is loaded we can tell SVGInjector which files to... inject -->
<script>
    // Elements to inject
    var mySVGsToInject = document.querySelectorAll('img.inject-me');

    // Do the injection
    SVGInjector(mySVGsToInject);
</script>
Applying this to our barebones Reveal.js presentation results in this markup:
<!doctype html>
<html lang="en">
    <head>
        <script src="svg-injector.min.js"></script>
        <!-- Rest of HTML HEAD comes here, including Reveal.js boilerplate -->
    </head>
    <body>
        <div class="reveal">
            <div class="slides">
                <section>
                    <h2>Mission (Im)possible: Making round toast</h2>
                    <img src="generated-diagram.svg" data-image-type="svg">
                </section>
            </div>
        </div>
        <script>
        // Elements to inject
        var svgDiagrams = document.querySelectorAll('img[data-image-type="svg"]');
        // Do the injection
        SVGInjector(svgDiagrams);
        </script>
    </body>
</html>
Wrapping it up and other caveats
Depending on the SVG editor that you used, there might still be a final hurdle
to overcome. For instance, Inkscape will gladly store the class attribute in
their enhanced SVG file, but as soon as you export the file as a plain SVG file
these extra attributes are gone. One workaround is to have a naming convention
and use that to find and enhance the desired elements in the injected SVG file.
SVGInjector offers support for just this kind of manipulation via the each
callback that can be passed as an option to the initial SVGInjector() call.
With this extra bit of logic, our code finally looks like this:
<!doctype html>
<html lang="en">
    <head>
        <script src="svg-injector.min.js"></script>
        <!-- Rest of HTML HEAD comes here, including Reveal.js boilerplate -->
    </head>
    <body>
        <div class="reveal">
            <div class="slides">
                <section>
                    <h2>Mission (Im)possible: Making round toast</h2>
                    <img src="generated-diagram.svg" data-image-type="svg">
                </section>
            </div>
        </div>
        <script>
        function addFragmentClass(svg) {
            // Find all elements in the SVG whose `id` begins with `"step"`
            var markedElements = svg.querySelectorAll('[id^="step"]');
            for (var i = 0; i < markedElements.length; i++) {
                // for each such element, add the "fragment" class that Reveal.js
                // will use to control how/when the element displays
                markedElements[i].classList.add("fragment")
            }
        }
        // Elements to inject
        var svgDiagrams = document.querySelectorAll('img[data-image-type="svg"]');
        // Do the injection
        SVGInjector(svgDiagrams);
        </script>
    </body>
</html>
One final caveat: the order in which Reveal.js displays fragments is DOM (or markup) order. This means that you have to make sure you author your SVG file in the order you want the fragments to be displayed. Inkscape (and possibly other editors as well) feature a built-in DOM editor that allow you to change the order of the elements to match your intended DOM order.